Native seeding or weeds? What satellite vegetation index can and can't tell you
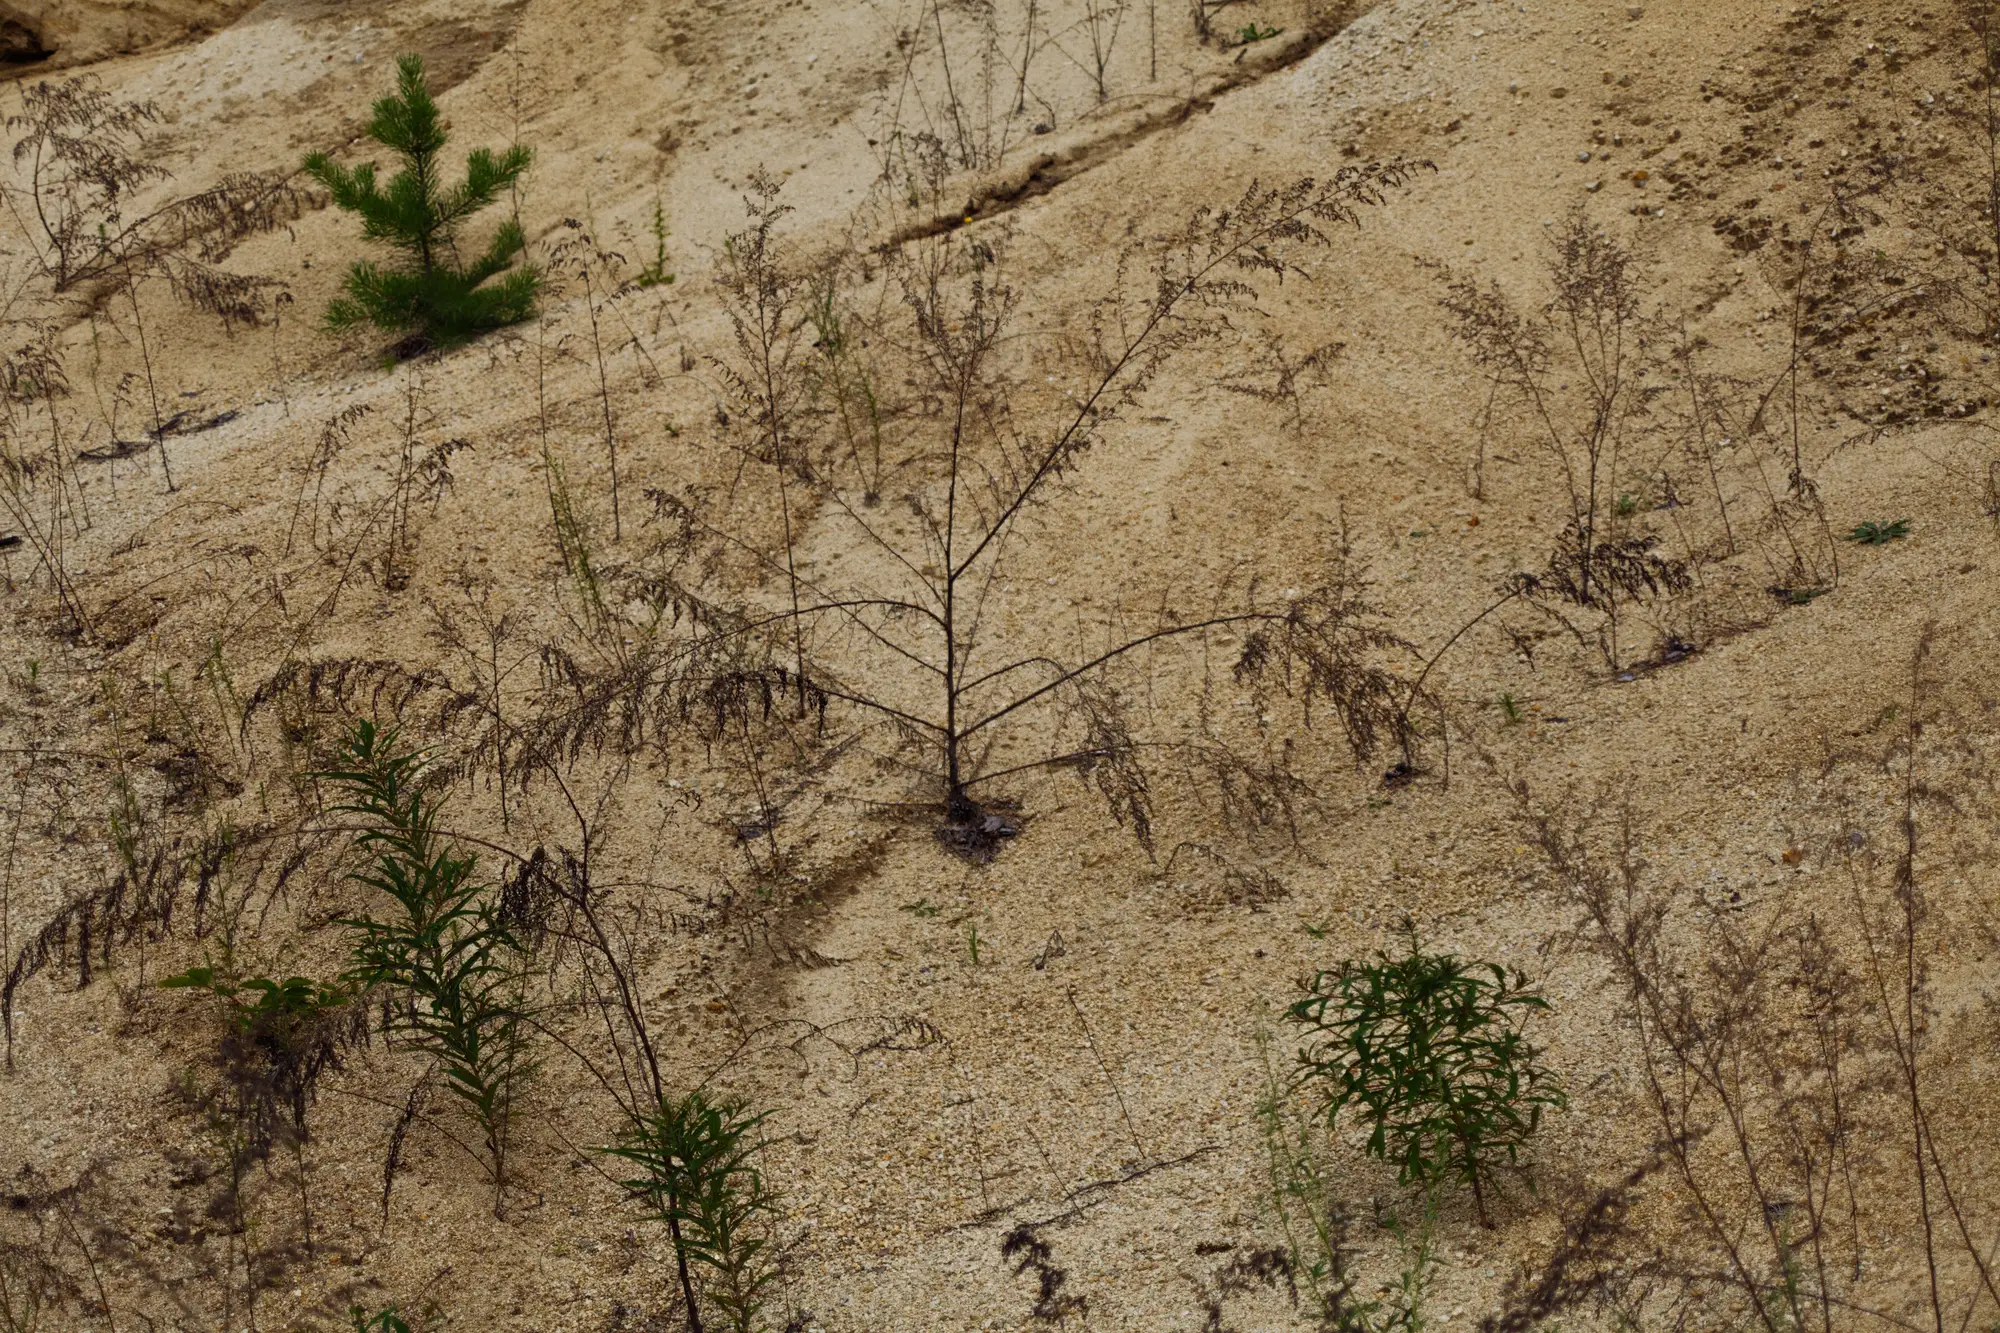
A closure report comes in showing 65% cover on a parcel that was bare three years ago. Good news, except for the question underneath it: is that cover the native seed mix the closure plan specified, or is it cheatgrass and kochia that moved in on their own because bare, disturbed ground is exactly what volunteer weeds are built for.
This question comes up every time a bond release package leans on a cover number without saying much about what's growing underneath it. It's worth being straight about what a satellite vegetation index can answer and what it can't.
What a vegetation index actually measures
A multispectral reading at 10 to 30 meter resolution measures how much live, photosynthesizing canopy is present over a pixel. It does not know if that canopy is western wheatgrass or Russian thistle. At that ground sample distance, a dense patch of annual weeds and a thinner stand of establishing native perennials can produce a similar index value in a given scene. Species identification from wide-swath satellite imagery isn't a thing this class of sensor does, and no vendor should tell a regulator otherwise.
So the honest framing is this: the index tells you how much green is there and how that's changing, parcel by parcel, year over year. It does not tell you what species is making the green.
The signals that do point one way or the other
Cover alone is a thin signal, but cover tracked over multiple seasons against the closure plan's own schedule says more than a single snapshot ever will.
A few things worth watching in a time series:
Timing of green-up and senescence. Many native perennial mixes specified in closure plans green up later and hold cover longer into a dry season than annual weeds, which flush early and die back fast once moisture runs out. A parcel that spikes green in spring and drops to near-bare by midsummer is behaving like an annual weed stand, not an establishing perennial seed mix.
Persistence year to year. Volunteer annuals are opportunistic. Cover from a weed flush can swing hard with a wet or dry year. A seed mix that's establishing tends to build cover more steadily across seasons, even if slower, because perennial root systems aren't starting from scratch each spring.
Trajectory against the bare-ground baseline. The closure plan sets milestones for a reason: 20% cover by year three, 40% by year five, whatever the permit specifies. A parcel tracking that curve is a different story than one that jumps to target cover in a single growing season and then collapses, which is a pattern more consistent with a weed flush than a seeded stand taking hold.
None of these signals are proof of species composition on their own. Together, across an annual record, they tell a regulator or an underwriter whether a cover number is worth a second look before it gets used to support a bond decision.
Where a site visit still has to do the work
When the pattern looks wrong, or when a bond release is close to final, species-level confirmation means a transect walk. That's not a gap Revegetation Monitor pretends to close. What a per-parcel vegetation index record does is flag which parcels deserve that walk and give a documented, year-over-year trail that doesn't rely on the operator's own self-reported progress report being the only account on file.
Revegetation Monitor reads that record once a year from wide-swath multispectral imagery and tracks it against the closure plan's own milestones, parcel by parcel, so the cover history sitting behind a bond release decision isn't something that has to be taken on faith.
If you're reviewing a closure report this season and want a cover record that stands on its own, Revegetation Monitor is built for exactly that.